San Francisco Crime Rate 2026 – How Safe Is the Bay Area?
San Francisco Crime Rate 2026 – How Safe Is the Bay Area?
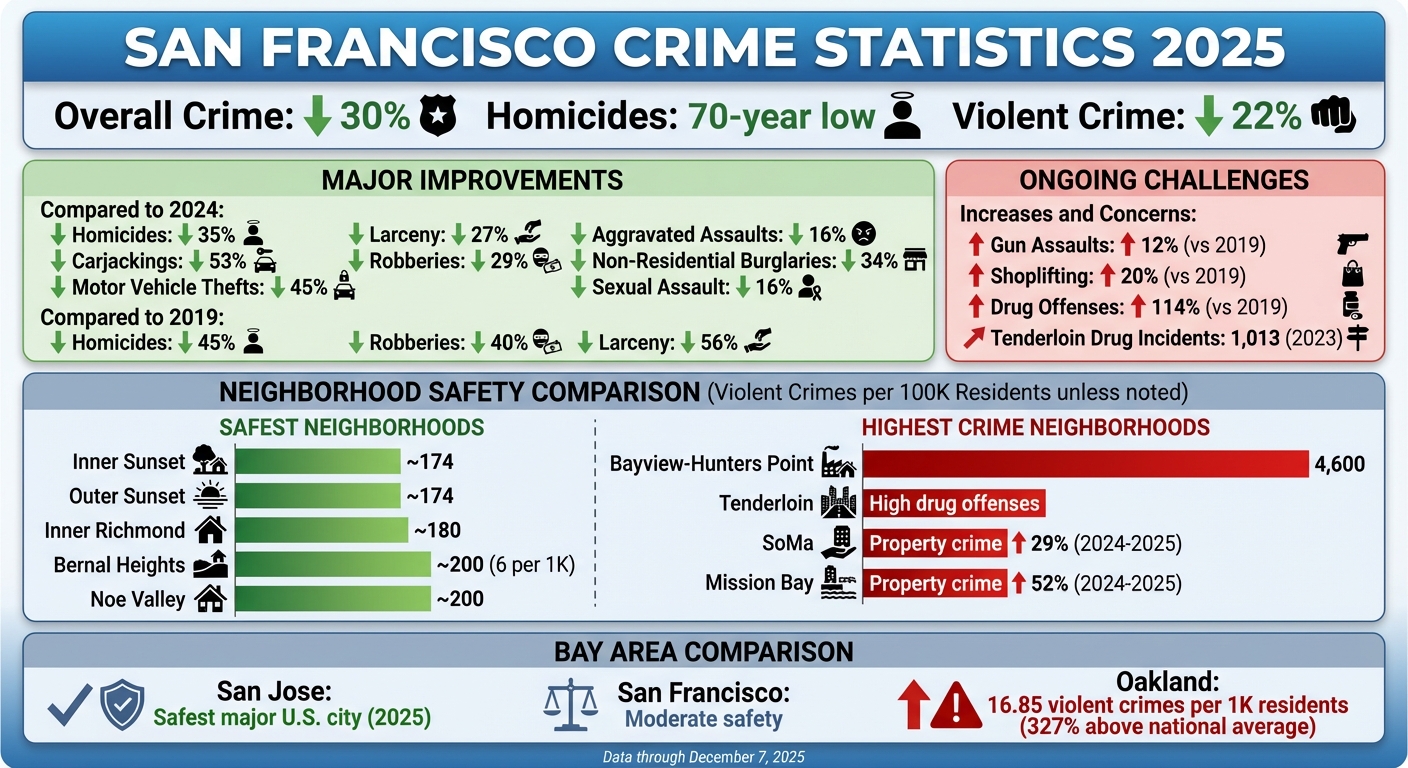
San Francisco's crime rates in 2025 show a mixed picture. While overall crime has dropped by 30%, and homicides reached a 70-year low, challenges like shoplifting and drug-related offenses persist in specific areas. Here's what you need to know:
- Major Improvements: Violent crimes, including homicides (-35%) and carjackings (-53%), have seen significant reductions compared to 2024. Motor vehicle thefts and larceny are also at their lowest levels in decades.
- Ongoing Issues: Gun assaults rose 12% compared to 2019, and shoplifting increased by 20%. Drug offenses remain a concern, especially in areas like the Tenderloin.
- Neighborhood Variations: Safer areas like Inner Sunset and Bernal Heights report low crime rates, while neighborhoods like the Tenderloin and Bayview-Hunters Point face higher incidents of violent and property crimes.
- Key Factors: Economic pressures, homelessness, and visible drug markets continue to influence crime trends. Enforcement efforts have yielded results, but disparities remain across neighborhoods.
Bottom Line: San Francisco is safer overall, but crime risks vary significantly by neighborhood. Use tools like AdensZip for detailed, location-specific data, and combine this with practical safety measures to navigate the city wisely.
San Francisco Crime Statistics 2025: Key Trends and Neighborhood Safety Comparison
San Francisco Exodus 2025: The 7 Reasons Nobody’s Talking About
San Francisco Crime Statistics for 2025
San Francisco's crime data for 2025 paints a picture of progress in many areas. The figures, updated through December 7, 2025, show notable reductions in several crime categories.
Violent crime has seen a significant drop. During the first half of 2025, the city reported 11 homicides - a 35% decrease compared to 2024. By August 10, 2025, this number rose slightly to 14 homicides, but it still marked a 36.4% decline from the previous year. Since 2019, homicides have fallen by an impressive 45%. Aggravated assaults were recorded at 149.6 incidents per 100,000 residents in the first half of 2025, showing a 16% drop from 2024 and a 10% decrease compared to 2019. Robberies also decreased by 29% year-over-year and are now 40% lower than in 2019. Carjackings followed the trend, dropping 53% from 2024 and 19% since 2019.
Property crime has also improved. Motor vehicle thefts were down 45% in the first half of 2025 compared to 2024 and 17% lower than in 2019. Larceny rates fell 27% from the previous year and 56% since 2019. Non-residential burglaries dropped by 34% year-over-year, with a 31% decline since 2019. Residential burglaries saw a smaller but still meaningful reduction of 9% compared to 2024.
However, not all trends were positive. Gun assaults rose 12% compared to 2019, though they were still 12% lower than in 2024. Shoplifting incidents increased by 20% in the first half of 2025 compared to 2019, highlighting ongoing challenges for retailers. Drug offenses also remain a concern in specific areas, such as the Tenderloin, which reported 1,013 drug-related incidents in the year leading up to August 23, 2023 - up from 821 during the same period in 2019.
Types of Crime in San Francisco: A Breakdown
From 2019 to 2025, San Francisco saw clear shifts in crime trends. Sexual assault rates in the first half of 2025 were 16% lower than the same period in 2024 and 5% lower than in 2019. Violent crime overall dropped by 22% in 2025 compared to the previous year, according to the Major Cities Chiefs Association.
Property crimes showed some of the most striking declines. For instance, car break-ins hit a 22-year low in 2024. Yet, challenges persist in certain categories; shoplifting, for example, rose 20% compared to 2019, creating ongoing difficulties for commercial districts. These contrasting trends highlight how broad improvements can sometimes overshadow localized problems that affect specific neighborhoods or businesses.
Crime Rates Vary by Neighborhood
While citywide crime statistics indicate progress, neighborhood data reveal a more complex picture. Some areas enjoy significant improvements, while others continue to struggle.
Neighborhoods like Inner Sunset boast the lowest crime rates, while areas such as the Tenderloin and Bayview-Hunters Point report much higher incidents. The safest neighborhoods - Outer Sunset, Inner Richmond, Bernal Heights, and Noe Valley - experience approximately 174 to 200 violent crimes per 100,000 residents annually. For example, Bernal Heights averages just 6 violent crimes per 1,000 residents. These areas benefit from lower population densities, active community involvement, and predominantly residential settings.
In contrast, neighborhoods with higher crime rates tell a different story. Bayview-Hunters Point, for example, records assault rates of about 4,600 per 100,000 residents and robbery rates near 538.7 per 100,000 - well above national averages. SoMa and Mission Bay have also faced challenges, with property crime increasing by 29% from 2024 to 2025. The SFPD Southern District, which includes SoMa, reported nearly double the larceny-theft incidents from January to August 2025 compared to 2024. While citywide violent crime dropped 14% and property crime fell 28% between January 2024 and January 2025, these improvements were uneven. Some neighborhoods saw a 46% drop in car break-ins, while others continued to grapple with theft issues.
Why Crime Data Can Be Incomplete
Despite offering valuable insights, crime data often fail to capture the full scope of safety in San Francisco. Several factors contribute to this gap.
Underreporting is a major issue, especially for property crimes like car break-ins and shoplifting. Many victims choose not to report these incidents, believing that police are unlikely to recover stolen items or that filing a report will not lead to meaningful outcomes. Additionally, enforcement priorities can skew the data. For instance, concentrated police efforts in areas like the Tenderloin or 6th Street Corridor may result in higher reported crime rates due to increased visibility. Conversely, neighborhoods with less police presence might appear safer on paper.
Evolving methods of data collection also complicate year-to-year comparisons. Changes in how offenses are categorized, advancements in reporting technology, and shifts in dispatch protocols all influence the numbers. For example, dispatch calls to hotspots like 16th and Mission streets have surged, but it remains unclear whether this reflects a genuine rise in crime or simply improved reporting practices.
While these limitations do not diminish the importance of the data, they underscore the need to consider individual experiences and localized information to fully understand San Francisco's safety dynamics.
Safety Levels Across Bay Area Neighborhoods
San Francisco Neighborhoods: Safety Comparison
San Francisco's neighborhoods each have distinct safety profiles, shaped by a mix of local factors. Residential areas that benefit from natural barriers, like hills or water, and strong community engagement often report lower crime rates. These differences highlight how safety can vary even within a single city, setting the stage for comparisons across the broader Bay Area.
San Francisco vs. Oakland and San Jose
When looking beyond San Francisco, safety levels across the Bay Area show significant variation. In 2025, San Jose earned the title of the safest major city in the United States, according to SmartAsset rankings. On the other hand, Oakland stands out as California's most dangerous major city, with a violent crime rate of 16.85 incidents per 1,000 residents - an alarming 327% above the national average. San Francisco falls somewhere in between, balancing elements of both safety and risk.
What Makes Some Neighborhoods Less Safe
Several factors contribute to why some neighborhoods face more safety challenges than others. Areas near transit hubs or bustling nightlife districts often see higher rates of petty theft and disorder. Additionally, neighborhoods like the Tenderloin, SoMa, Mission District, and Civic Center - known for visible drug activity and homelessness - tend to experience elevated crime levels. Economic conditions also play a role, as higher poverty rates, income inequality, and transient populations often correlate with increased crime. Conversely, areas with active community organizations and natural geographic advantages generally enjoy lower crime rates. Recognizing these dynamics can help both residents and visitors make smarter, safer decisions.
sbb-itb-6d427fc
What Drives Crime in San Francisco
Economic and Pandemic Effects on Crime
San Francisco's economy has undergone significant changes that have influenced local crime patterns. With rising unemployment tied to a decline in white-collar jobs and a staggering 34.8% office vacancy rate in key districts, the city has seen reduced natural surveillance in these areas. This lack of activity creates opportunities for criminal behavior.
The pandemic also played a major role in shaping crime trends during previous years. The social and economic disruptions it caused led to spikes in certain types of crime. However, as the pandemic's influence diminishes, other factors like ongoing economic pressures have taken center stage in driving shifts in local crime.
Homelessness, Drug Markets, and Retail Theft
The city continues to grapple with visible homelessness, thriving open-air drug markets, and retail theft. Drug-related offenses have surged by 114%, while shoplifting has climbed 20% compared to 2019. As enforcement tightens in some areas, criminal activity has shifted to neighborhoods like SoMa and Mission Bay. For instance, SoMa saw a 29% rise in property crime in early 2025, while Mission Bay experienced a dramatic 52% increase, largely due to car break-ins and shoplifting.
A stark example of this trend comes from a Target store at Fourth and Mission streets, where shoplifting incidents skyrocketed from 18 to 83 by the end of April compared to the previous year.
Government Response to Crime in 2025
To address these challenges, law enforcement has ramped up its efforts. Joint operations in 2023 led to significant results, including the seizure of nearly 700 pounds of fentanyl, over 6,200 citations issued, more than 500 arrests made, and the recovery of over 115 stolen vehicles. Additionally, the state's Organized Retail Crime Task Force has been instrumental in recovering over 1.4 million stolen retail items - valued at nearly $60.2 million - and arresting nearly 4,600 suspects since October 2019.
Further steps have been taken in 2025, such as introducing new Highway Patrol teams and launching the "Rebuilding the Ranks" program to strengthen local law enforcement. The San Francisco Police Department (SFPD) has also targeted hotspots like SoMa. SFPD spokesperson Paulina Hendersen emphasized their commitment to the area:
SOMA is currently an area where SFPD is devoting resources to combat larceny and other crimes targeting our businesses. The SFPD will continue to make this neighborhood a priority, focusing on the safety of our residents, businesses, and visitors.
How to Make Safer Decisions About San Francisco
Using AdensZip to Assess Safety by Location

AdensZip uses AI-driven crime intelligence to break down data by ZIP code and neighborhood, offering a detailed view of safety across San Francisco. This approach supports smarter decision-making when it comes to urban safety.
One of its standout features is the Livability Score, which combines crime statistics with factors like cost of living and local amenities. This gives you a well-rounded picture of a neighborhood, helping you weigh potential risks alongside other important considerations. By staying informed about current crime trends, you can make more confident choices. Of course, data is just one piece of the puzzle - practical steps also play a big role in staying safe.
Safety Tips for Residents, Workers, and Visitors
Being aware of risks specific to a neighborhood is essential. For example, in areas with higher property crime, avoid leaving valuables in plain sight and opt for secure parking options.
For residents, deciding where to live often involves balancing safety with other factors like affordability and commute times. Crime data can help identify pockets of neighborhoods with lower incident rates. Visitors, on the other hand, should look for accommodations in areas with fewer property crimes and stay vigilant in tourist-heavy zones, where pickpocketing and theft are more common.
Combining Data with Common Sense
While tools like AdensZip provide valuable insights, day-to-day habits are equally important for staying safe. Pairing data with practical precautions ensures a more comprehensive safety strategy. Even in neighborhoods with lower crime rates, staying alert, securing your belongings, and trusting your instincts are key.
If you need to visit an area with higher property crime, consider parking in a garage rather than on the street, avoid walking alone at night, or take an alternative route. By blending AdensZip's AI-powered insights with smart, everyday choices, you can navigate San Francisco with greater peace of mind.
Conclusion: Safety and Living in San Francisco
Main Findings from 2025 Crime Data
Crime rates in San Francisco saw a notable drop in 2025, with several categories hitting record lows. This progress highlights the combined impact of stronger law enforcement strategies and community involvement. That said, not all areas of concern have improved. Crimes like gun assaults, shoplifting, and drug-related offenses either increased or stayed higher than pre-pandemic levels, reminding us that challenges remain.
The city’s neighborhoods show varying safety profiles, emphasizing the importance of localized evaluations. These findings highlight how crucial it is to take a detailed, area-specific approach when assessing safety.
How AI Analytics Can Improve Safety Decisions
AI analytics take these insights to the next level by offering tools that help you make smarter, more informed decisions about safety. AI-powered platforms provide hyper-local crime data that go beyond what traditional statistics reveal. For example, AdensZip’s Livability Score combines crime data with information on cost of living and amenities, creating a single, easy-to-understand metric.
These tools also deliver real-time updates and alerts about incidents, helping you make quick decisions - whether it’s for your daily routine or planning a trip. The takeaway? Use data as your guide, but pair it with practical safety habits tailored to the places you live in and visit.
FAQs
How safe is San Francisco in 2025 compared to previous years?
In 2025, San Francisco has experienced a sharp decline in crime rates compared to previous years. Violent crimes have dropped by an estimated 22–30%, homicides have fallen by an impressive 45%, and property crimes, such as car theft and burglaries, have also seen a meaningful reduction.
This progress is largely credited to improved law enforcement tactics and stronger collaboration with local communities, creating a safer environment for both residents and visitors. While safety levels still differ across neighborhoods, the overall trend points to a brighter outlook for San Francisco in 2025.
What are the safest neighborhoods in San Francisco in 2025?
San Francisco in 2025 continues to have neighborhoods that stand out for their safety and welcoming atmosphere. Among these are Nob Hill, Sea Cliff, Presidio Heights, Outer Sunset, Inner Sunset, Outer Richmond, Inner Richmond, Noe Valley, Bernal Heights, and Glen Park. These areas are recognized for their lower crime rates and a strong sense of community.
While safety can depend on various factors, these neighborhoods consistently earn a reputation for being secure and family-friendly, making them attractive options for both residents and visitors.
What causes crime rates to differ between San Francisco neighborhoods?
Crime rates across San Francisco neighborhoods can differ widely, shaped by a mix of important factors. Socioeconomic conditions, like income disparities and access to essential resources, have a noticeable impact. The presence of law enforcement and the effectiveness of community-driven crime prevention efforts also influence neighborhood safety.
Other elements, such as demographics and the strength of community engagement, play a part too. Areas where residents build strong social connections and actively participate in local initiatives tend to see lower crime rates. On top of that, infrastructure factors - like well-lit streets and thoughtfully designed public spaces - can affect both how safe people feel and the actual occurrence of crime.
By considering these aspects, both residents and visitors can better navigate safety concerns in the Bay Area.