Jacksonville Safety Score 2026 – Crime Trends & Neighborhood Data
Jacksonville Safety Score 2026 – Crime Trends & Neighborhood Data
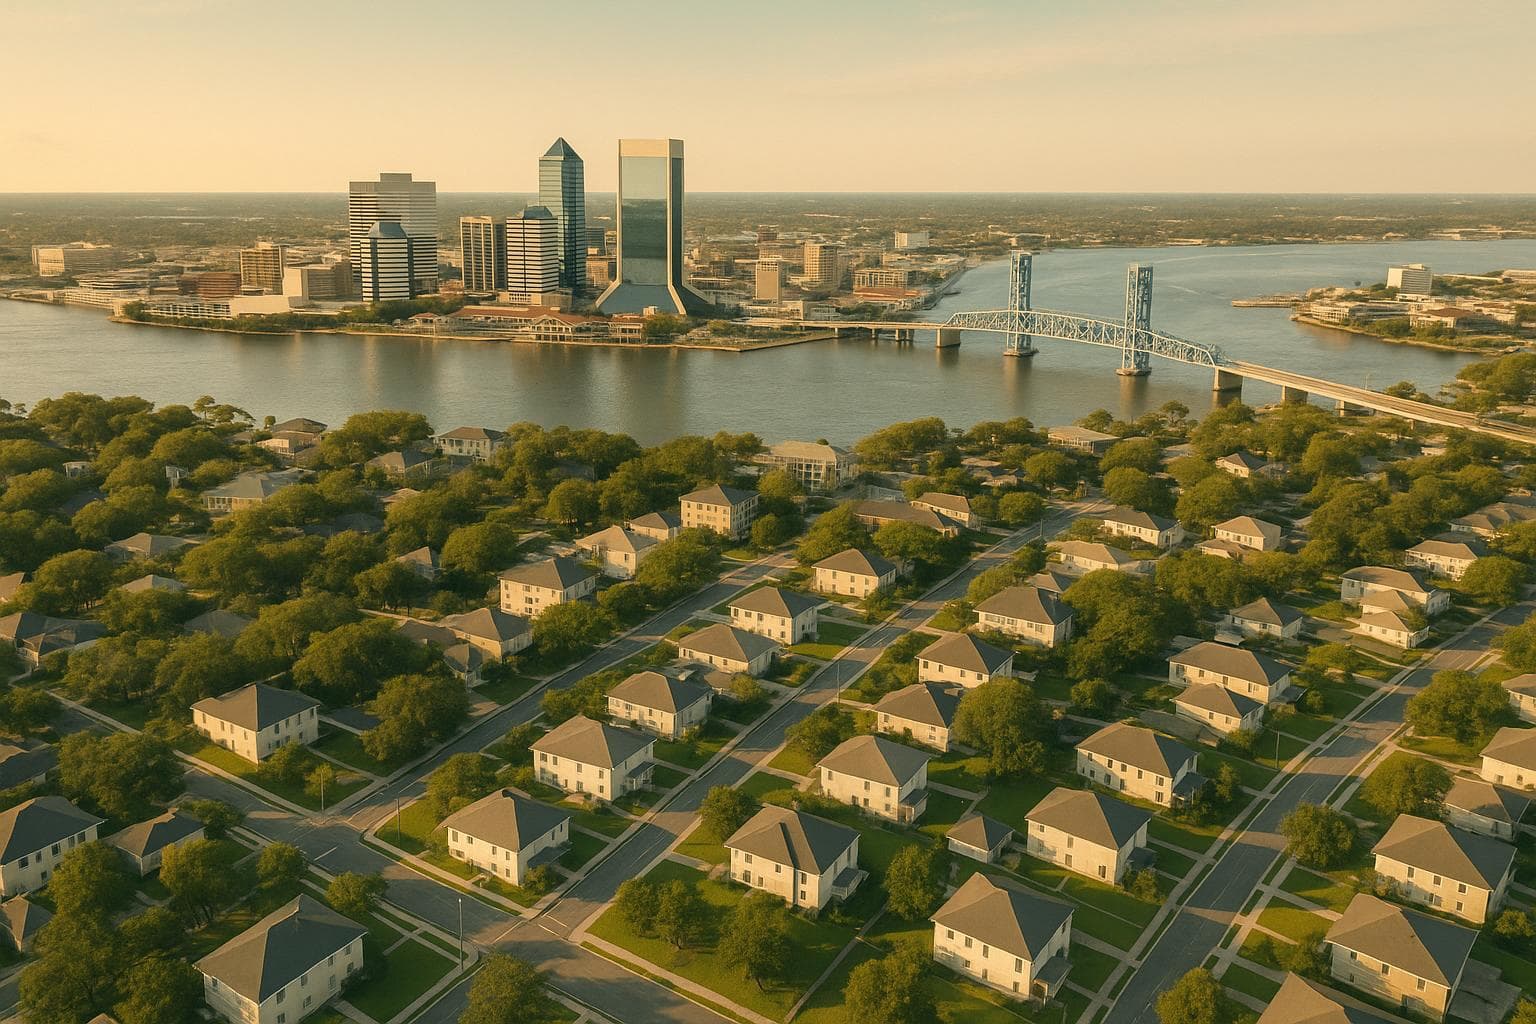
Jacksonville's safety varies greatly by neighborhood, with crime trends showing both progress and ongoing challenges in 2026. Here's what you need to know:
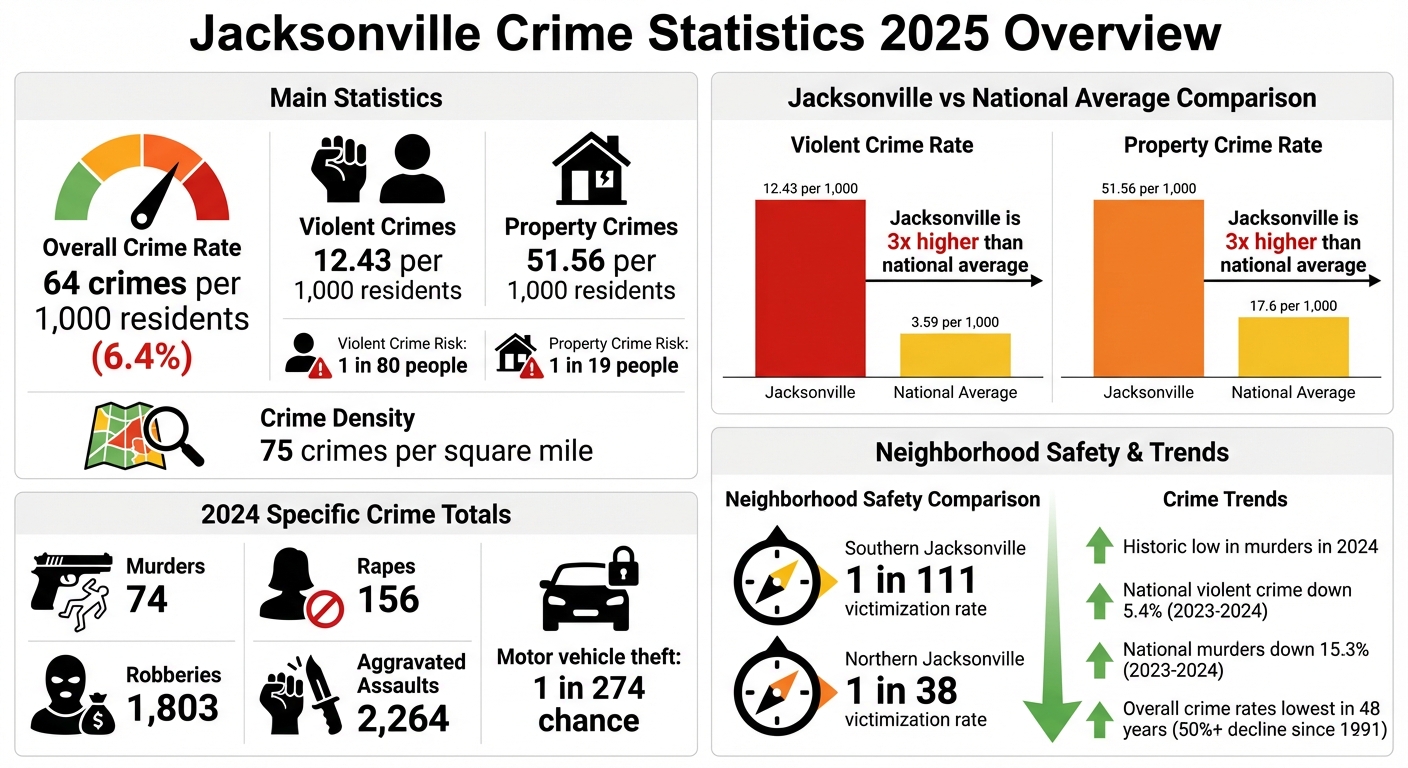
- Citywide Crime Rate: Jacksonville reports 64 crimes per 1,000 residents, with property crimes (51.56 per 1,000) far outpacing violent crimes (12.43 per 1,000).
- Safer Areas: Southern neighborhoods like Greenland and Arlington Hills offer lower crime rates (1 in 111 chance of victimization) and affordable rents.
- Higher-Risk Areas: Northern neighborhoods, including 32209 ZIP code areas like Grand Park and Magnolia Gardens, face higher violent crime rates, particularly gun violence.
- Trends: Crime rates have declined over the past two years, with 2024 seeing historic lows in murders. However, property crimes like package theft remain a concern.
- AI Tools for Safety: Platforms like AdensZip analyze crime, rent, and other factors to help you find safer, affordable neighborhoods.
Understanding Jacksonville's safety requires focusing on neighborhood-specific data, not just citywide averages. Whether you're relocating or planning your routine, staying informed is key.
Historic year: Jacksonville sees lowest number of homicides in a year this century in 2024
Jacksonville Crime Trends: 2025 Overview
Jacksonville Crime Statistics 2025: Safety Comparison by Neighborhood
To truly understand Jacksonville's safety landscape, it's helpful to compare the city's crime statistics to broader benchmarks. The numbers provide a clear picture of where things currently stand and how they've changed over time. These insights lay the groundwork for a closer look at neighborhood-specific safety rankings later on.
2025 Crime Rates
Jacksonville's annual crime rate sits at 64 incidents per 1,000 residents, or approximately 6.4%. Breaking it down further, the city reports 12.43 violent crimes and 51.56 property crimes per 1,000 people. What does this mean for residents? Roughly one in 80 people may experience a violent crime, while one in 19 faces the likelihood of a property crime.
When compared to national averages, Jacksonville's crime rates are noticeably higher. In 2024, the FBI reported national crime rates of 3.59 violent crimes and 17.6 property crimes per 1,000 people, making Jacksonville’s figures more than three times higher. It's also evident that property crimes significantly outnumber violent crimes in the city.
Crime Trends Over Recent Years
Over the past two years, Jacksonville has seen a decline in crime rates, with 2024 marking a historic low in murder counts. On a national level, violent crime dropped by 5.4% from 2023 to 2024, while murder and non-negligent homicides fell by 15.3%. In fact, both violent and property crime rates in 2024 were the lowest recorded in at least 48 years, reflecting a more than 50% decline since 1991.
However, not all trends are positive. Package theft has emerged as a growing issue within Jacksonville.
Where Crime Occurs in Jacksonville
Crime in Jacksonville is not evenly spread across the city. The northern areas report the highest number of incidents, which heavily influence the overall statistics. On average, Jacksonville sees 75 crimes per square mile, but this density varies significantly between neighborhoods. While some northern neighborhoods struggle with elevated violent crime rates, others throughout the city maintain much safer conditions.
High-traffic areas, such as shopping districts and airports, often show inflated crime figures due to the sheer number of people passing through. This doesn't necessarily mean these spots are unsafe for residents. Recognizing these geographic patterns is crucial for making smart decisions about where to live, work, or spend time in Jacksonville. In the next section, we’ll dive into neighborhood-specific crime data to help guide safer relocation choices.
Neighborhood Safety Rankings
Jacksonville's neighborhoods show a wide range of safety levels, with some areas experiencing fewer crimes while others face persistent challenges. Understanding these differences helps both residents and newcomers make informed decisions about where to live.
Here’s a closer look at how safety varies across Jacksonville's neighborhoods.
Safest Neighborhoods in Jacksonville
Southern Jacksonville stands out as the safest area, with a crime victimization rate of 1 in 111, compared to 1 in 38 in northern neighborhoods. These areas benefit from suburban layouts, visible security measures, and strong community connections, all of which contribute to lower crime rates.
Higher-Risk Neighborhoods
Northern Jacksonville struggles with higher crime rates. The 32209 ZIP code, which includes neighborhoods like Grand Park, Magnolia Gardens, and Royal Terrace, reports significant levels of gun violence, particularly homicides. Other areas, such as Hogan's Creek, College Gardens, New Town, Moncrief Park, Lackawanna, and Brentwood, also deal with elevated incidents of assaults, robberies, and car break-ins.
A "code of silence" within these communities often complicates law enforcement efforts. As of 2025, Jacksonville recorded 74 murders, 156 rapes, 1,803 robberies, and 2,264 aggravated assaults. Motor vehicle theft is another major concern across the city, with a 1 in 274 chance of a car being stolen - placing Jacksonville among the highest in the nation for this type of crime.
Neighborhoods with Mixed Safety Profiles
Downtown Jacksonville presents a mixed picture. While homelessness contributes to some safety concerns, Gates Law Firm describes it as "largely regarded as safe for families when they remain in well-lit, busy areas". The city has increased police patrols and improved street lighting, which has helped reduce crime in the area.
Baymeadows experiences moderate crime rates, with 5.0 violent crimes and 18.0 property crimes per 1,000 residents. The area benefits from strong lighting and active retail spaces. Continued commercial development near Southside Boulevard is expected to boost foot traffic through late 2025, potentially impacting crime dynamics. Windy Hill reports 5.6 violent crimes and 16.5 property crimes per 1,000 residents. While the neighborhood has good streetlight coverage, ongoing roadwork along Hogan Road and Gate Parkway may temporarily affect visibility.
Duclay sees slightly higher rates, with 6.4 violent crimes and 19.8 property crimes per 1,000 residents. Improvements such as better lighting and pedestrian-friendly upgrades could enhance safety over time. When reviewing these neighborhoods, it’s important to consider both crime rates and the types of nearby destinations. High visitor traffic in commercial areas can sometimes skew crime statistics.
sbb-itb-6d427fc
How AI Analytics Support Relocation Planning
AI Methods for Urban Safety Analysis
AI analytics take safety score assessments to the next level, making them practical tools for relocation planning. These platforms pull together a wide range of data - violent and property crime rates, rent costs, school quality, walkability, and even streetlight density - into a single safety index. The index assigns weights to each factor, with violent crime carrying the most influence at 36%, followed by property crime at 24%, and smaller weights for the remaining elements. For example, in Jacksonville, crime rates are 60–80% higher than the national average. However, the total crime cost per resident is $201–$264 lower than the national average, offering a nuanced perspective on safety and affordability. These AI-powered insights provide a solid starting point for making informed relocation choices.
Using AdensZip for Relocation Decisions

AdensZip simplifies relocation planning with its AI-driven reports, blending crime statistics, climate data, cost of living, job market trends, and real estate details into a single Livability Score. This comprehensive approach helps users weigh their options efficiently. For instance, the platform highlights that some of Jacksonville's safest neighborhoods - like Greenland, Duclay, Arlington Hills, and Arlingwood - offer rents at or below the citywide average. This makes it possible for families and professionals to prioritize safety without breaking the bank, even if it means sacrificing certain conveniences like proximity to work or extra amenities.
How to Use Safety Scores in Daily Decisions
When evaluating neighborhoods, compare both per-capita and total crime rates, keeping in mind that areas with high visitor traffic may show inflated numbers. Look for communities with essential security features such as controlled access, smart locks, and well-lit parking areas. Stay up-to-date on local crime trends by using tools like the Jacksonville Police Department crime maps, CrimeGrade.org, and local news alerts. This proactive approach ensures you’re making well-informed decisions before committing to a move.
Conclusion
Jacksonville's safety landscape in 2025 is far from straightforward. Focusing solely on citywide crime statistics overlooks the unique conditions shaping each neighborhood.
The data shows that safety and affordability coexist in certain areas, even as property crimes outpace violent offenses. This highlights the importance of having detailed, real-time information to truly understand local dynamics.
That's where advanced tools come into play. Platforms like AdensZip can combine crime statistics with factors like rent prices, school quality, and walkability. This kind of integrated analysis ensures that your relocation choices are based on a full picture of what matters most to your lifestyle.
Making informed decisions requires more than just broad figures. Neighborhood-level insights, supported by AI-driven tools, can help you identify areas that align with your priorities - whether that's safety, affordability, or access to key amenities.
FAQs
Why do northern Jacksonville neighborhoods tend to have higher crime rates?
Northern Jacksonville neighborhoods face a noticeable challenge with higher crime rates, influenced by various factors. These areas see more property crimes, including burglaries and vehicle thefts, alongside violent crimes like assaults and robberies. Several issues contribute to this, such as lower levels of community involvement, limited access to security measures, and ongoing socioeconomic struggles.
Recognizing these patterns can empower residents and visitors to take steps to enhance personal safety while highlighting the need for stronger community support in these neighborhoods.
How does AdensZip use AI to help find safe neighborhoods in Jacksonville?
AdensZip leverages cutting-edge AI to evaluate crime patterns, neighborhood safety ratings, and comprehensive local data. With this tool, you can effortlessly pinpoint safer areas in Jacksonville using the latest insights.
Whether you're relocating, traveling, or working in Jacksonville, AdensZip equips you with practical details to confidently choose neighborhoods that align with your priorities.
How do violent and property crime trends in Jacksonville differ?
Violent crimes in Jacksonville, like homicides and assaults, have decreased in 2025 compared to prior years, showing progress toward a safer community. Meanwhile, property crimes, such as theft and burglary, continue to be more frequent but have maintained a steady rate over time.
The distinction between these two categories is clear: violent crimes are less common but carry more severe consequences, while property crimes happen more often but tend to be less serious. Keeping these patterns in mind can guide you in making smarter choices about where to live, work, or spend your time.