Houston Safety Breakdown – Violent Crime, Trends & Risk Zones
Houston Safety Breakdown – Violent Crime, Trends & Risk Zones
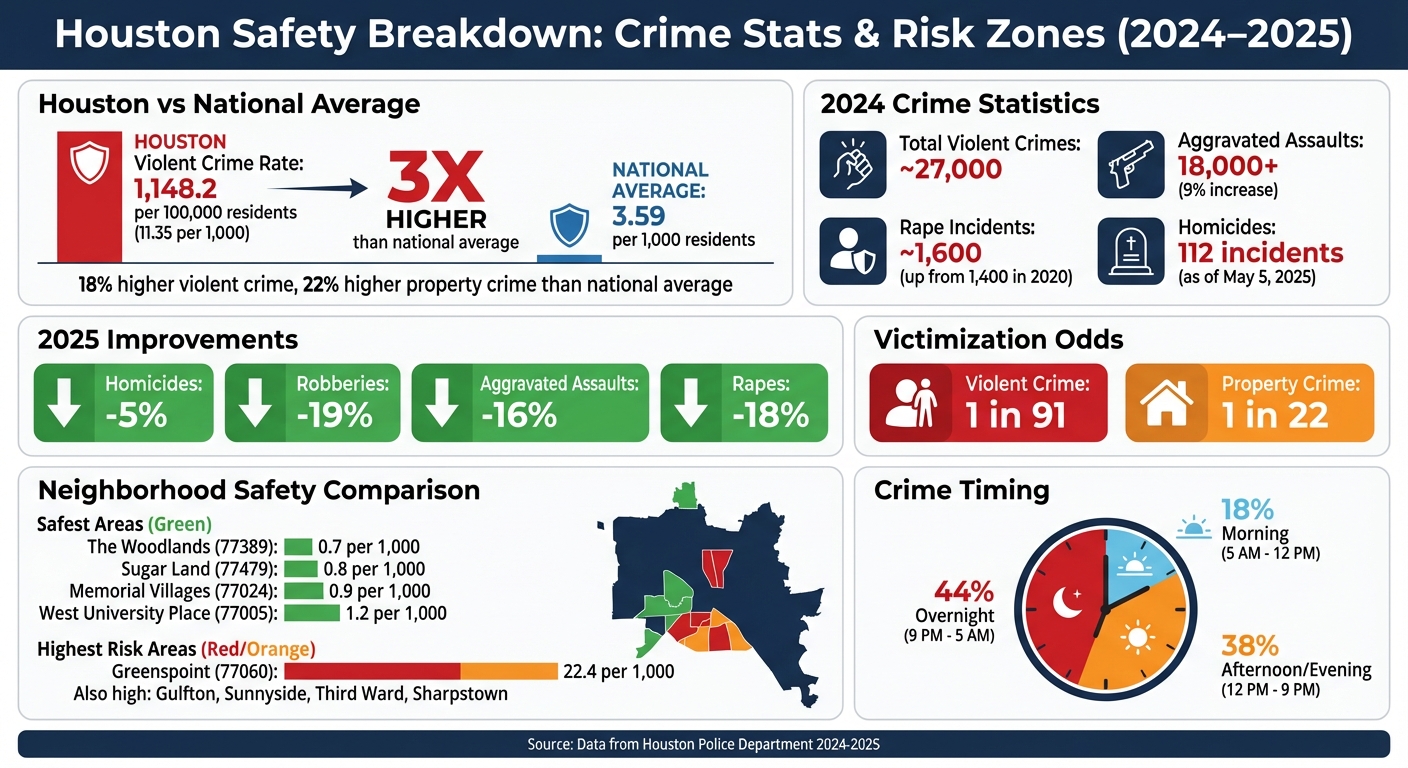
Houston's violent crime rate in 2024 was over three times the national average, with 1,148.2 incidents per 100,000 residents - making it one of the most dangerous cities in the U.S. Key takeaways:
- 2024 Crime Stats: Nearly 27,000 violent crimes, including a 9% rise in aggravated assaults.
- Improvement in 2025: Early 2025 saw declines in homicides (-5%), robberies (-19%), aggravated assaults (-16%), and rapes (-18%).
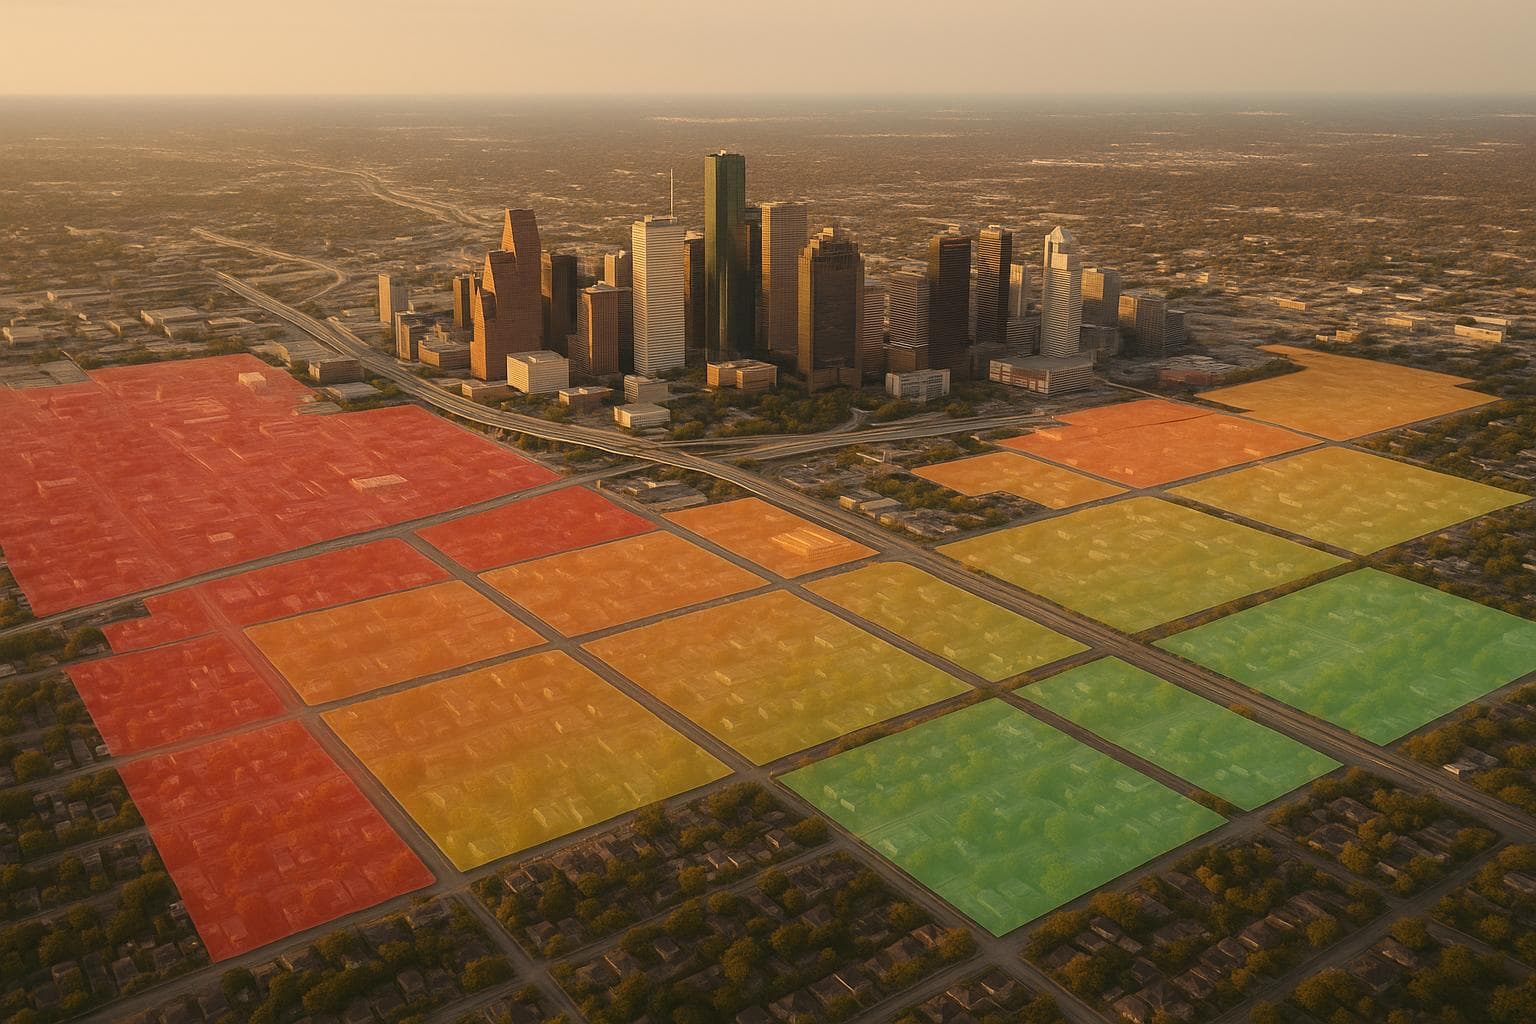
- High-Risk Areas: Neighborhoods like Greenspoint, Gulfton, and Sunnyside report significantly higher crime rates.
- Safer Zones: West University Place (77005) and Memorial Villages (77024) have some of the lowest crime rates in the area.
- Odds of Victimization: 1 in 91 for violent crimes and 1 in 22 for property crimes.
Crime patterns vary significantly across neighborhoods and even specific blocks. Tools like AdensZip can help analyze safety data by ZIP code for more informed decisions.
Houston Crime Statistics 2024-2025: Rates, Trends & Neighborhood Safety Comparison
Current Violent Crime Statistics in Houston
Citywide Crime Numbers
In 2024, Houston recorded a violent crime rate of 1,148.2 incidents per 100,000 residents. Aggravated assault accounted for the majority of these crimes, with over 18,000 reported cases - marking a 9% increase compared to the previous year. Reports of rape also climbed, reaching approximately 1,600 incidents, up from 1,400 in 2020. These numbers provide a snapshot of the broader crime trends in the city.
Recent Changes in Crime Rates
By early 2025, Houston saw a decline in most violent crime categories. Rape cases dropped from 362 to 325, robberies fell from 1,587 to 1,354, and aggravated assaults decreased from 4,212 to 3,653. However, homicides initially rose, with 112 incidents compared to 104 during the same period in 2024 (up to May 5, 2025). A six-month trend later revealed a reversal, with homicides dipping by 5%, robberies down nearly 19%, aggravated assaults dropping over 16%, and rapes decreasing by 18%. These shifts followed a 4% increase in violent crime throughout 2024, which had disrupted a consistent decline in crime rates since 2020. Despite these mixed trends, the question remains: how does Houston's safety compare on a national scale?
How Houston Compares to Other Cities
Houston’s violent crime rate in 2024 stood at 11.35 incidents per 1,000 residents - more than three times the national average of 3.59 per 1,000 residents. The city's homicide trends diverge from national patterns. While many major U.S. cities reported a decline in homicides in early 2025, Houston experienced an increase during the same period. This contrast underscores the unique safety challenges the city faces, even as other violent crime categories show signs of improvement.
Crime Trends Over Time and Contributing Factors
Crime Patterns from 2020 to 2025
Between 2020 and 2025, Houston saw significant shifts in violent crime rates. The early pandemic years brought a surge in violence, with July 2021 standing out as the deadliest month, recording 62 homicides. While certain months during this period saw spikes in crime, the overall trend shifted downward after this peak. However, homicides experienced a brief rise in early 2025 before resuming their decline. These fluctuations highlight the complex and evolving nature of crime in Houston, pointing to multiple underlying factors.
What Drives Crime in Houston
Economic challenges have a clear impact on crime rates in Houston. With a median household income of $60,426 and a poverty rate of 20.7%, the city faces conditions that can contribute to criminal activity. Federal funding and local community programs have helped address these issues to some extent. Initiatives like "One Safe Houston" have also shaped policing tactics, though gun violence remains a major concern. In Harris County, the firearm fatality rate stands at 16.4 deaths per 100,000 residents. These economic and social pressures intertwine with other factors, influencing when and where crimes are more likely to occur.
When Crime Happens Most
The timing of violent crimes in Houston follows noticeable patterns. Nearly 44% of murders happen overnight, between 9 p.m. and 5 a.m., while 38% occur during the afternoon and evening hours, from 12 p.m. to 9 p.m. The remaining 18% take place in the morning, between 5 a.m. and 12 p.m.. While there isn’t a clear seasonal trend in homicides, certain summer and fall months have seen higher numbers of incidents. This timing aligns with broader shifts in Houston's crime trends over the 2020–2025 period, offering insight into when residents may be at greater risk.
Where Crime Happens: Risk Zones and Safer Areas
Areas with Higher Crime Rates
In Houston, certain neighborhoods and zip codes tend to see more crime than others. Areas like Greenspoint, Gulfton, Sharpstown, Third Ward, Sunnyside, Alief, Midwest, Northside, Uptown, Downtown, Midtown, and South Park consistently report higher rates of violent crime. Places with major attractions - such as Downtown Houston, The Medical Center, Midtown, and Uptown - also experience elevated crime rates per capita. This is largely due to their dense populations and heavy foot traffic.
To address these challenges, Houston's new mayor, John Whitmire, has made crime reduction a priority, focusing on nine neighborhoods with the highest crime rates. His strategy includes ramping up law enforcement efforts in these areas. Greg Fremin highlights another issue: rapid population changes. As communities grow or shift, they often lose the support systems - like churches, schools, and local organizations - that play a critical role in preventing crime. These high-risk zones stand in stark contrast to neighborhoods with much lower crime rates.
Areas with Lower Crime Rates
On the flip side, some Houston neighborhoods enjoy notably lower violent crime rates. For instance, West University Place (77005) reports just 1.2 violent crimes per 1,000 residents. This is largely thanks to private security patrols and the area's walkable, affluent community. Memorial Villages (77024) does even better, with only 0.9 violent crimes per 1,000 residents, benefiting from gated communities and their own dedicated police force. Beyond Houston's city limits, Sugar Land (77479) and The Woodlands (77389) report even lower rates - 0.8 and 0.7 violent crimes per 1,000 residents, respectively.
These safer neighborhoods often share common features: thoughtful urban planning, strong community networks, and higher socioeconomic conditions. For example, Houston Heights (77007) earns an A safety grade, supported by active civic clubs and off-duty patrol programs. Similarly, River Oaks (77027) is known for its private armed security, which protects its high-value properties. While violent crimes like murder and robbery have decreased by 12% since 2023, car burglaries and theft remain persistent issues across many parts of the city. Even within these safer areas, understanding crime trends at a more granular level can provide deeper insights.
Block-Level Crime Patterns
Drilling down to block-level data reveals that safety can vary significantly, even within neighborhoods labeled as high-risk. The Houston Police Department (HPD) updates crime data monthly, detailing incidents by street name and block range. This allows residents to better understand safety conditions in their immediate surroundings. In many cases, crime hotspots are concentrated around specific intersections or street segments, while nearby blocks may experience far fewer incidents.
Doug Griffith, president of the Houston Police Officers Union, underscores the need for more patrols, citing recruitment and retention struggles within the department. Meanwhile, Clete Snell, a criminal justice professor at the University of Houston-Downtown, advises residents to focus on crime trends in their own neighborhoods rather than relying solely on citywide statistics. The HPD’s switch from UCR to NIBRS reporting has made it easier to pinpoint these localized patterns and track shifts in crime over time.
sbb-itb-6d427fc
How to Use Crime Data for Safety Decisions
Reading and Understanding Crime Statistics
Crime statistics can be tricky to interpret without some context. Per capita rates - which measure crimes per 1,000 residents - are a good starting point for comparing neighborhoods. But keep in mind that high-traffic areas like shopping districts, airports, parks, or schools can skew these rates upward. When evaluating a neighborhood, it’s essential to look at both the types of crimes being reported and how those numbers are changing over time. For instance, a neighborhood experiencing a decline in violent crime but a rise in property crime presents a very different safety picture than one showing the opposite trend.
Numbers alone don’t tell the full story. Factors like population density, local economic conditions, and the presence of commercial hubs all play a role in shaping crime statistics. For example, Houston's violent crime rate is about 18% higher than the national average as of late 2025. However, this citywide figure hides significant variations between neighborhoods - even from block to block. To get a better sense of safety, it’s much more useful to focus on neighborhood-specific data rather than broad citywide averages.
Where to Find Local Safety Information
If you’re looking for detailed crime data in Houston, the Houston Police Department (HPD) is a great place to start. They publish monthly updates on their website, breaking down crimes by street and police beat in Excel spreadsheets. These updates are usually available 1–2 weeks after the end of each month. This block-level data can give you a granular view of safety conditions in specific areas.
Local news outlets are another valuable resource. They often track crime trends and provide additional context about incidents or emerging patterns in various parts of the city. Combining HPD’s detailed data with insights from local news can help you form a clearer picture of safety in any given area. For instance, HPD’s data often shows that safety conditions can vary widely, even within neighborhoods that are generally considered high-risk.
Using AdensZip for Safety Analysis

Digital tools like AdensZip make it easier to analyze safety data without getting bogged down in spreadsheets. AdensZip provides AI-powered safety profiles for Houston neighborhoods, offering insights at the ZIP code level. The platform compiles official crime data and combines it with other important factors like cost of living, climate, and real estate trends, giving you a more complete picture of neighborhood safety.
For $9.99/month, the Premium plan offers a deeper dive into crime data. It breaks down violent and property crime trends, helping you understand not just how much crime occurs, but also the most common types of incidents in specific areas. By layering crime statistics with livability factors, AdensZip helps you determine whether a neighborhood fits your safety priorities and lifestyle preferences.
Breaking down violent crime statistics in Houston
Conclusion
Houston's safety challenges are both widespread and deeply tied to specific neighborhoods. As of late 2025, the city's violent crime rate sits 18% above the national average, with property crime exceeding it by 22%. In 2024 alone, 27,000 violent crimes were reported, reflecting a 4% increase overall and a 9% rise in aggravated assaults. Alarmingly, over 99% of Texas communities report safer conditions than Houston.
However, these numbers tell only part of the story. Safety in Houston can vary drastically from one neighborhood to another - even within a few blocks. For instance, West University Place (ZIP code 77005) boasts an A+ safety rating with just 1.2 violent crimes per 1,000 residents. In stark contrast, Greenspoint (ZIP code 77060) faces an estimated 22.4 violent crimes per 1,000 residents. Additionally, residents in historically redlined neighborhoods endure a 4.8% higher risk of violent victimization. These disparities highlight the importance of analyzing safety at a neighborhood level.
To make informed decisions about safety in Houston, it's crucial to dive into neighborhood-specific data. By examining crime trends within individual ZIP codes, identifying areas on the rise or in decline, and factoring in elements like private security or community involvement, you can gain a much clearer understanding of local safety. While the overall odds of experiencing violent crime in Houston are 1 in 91 and property crime 1 in 22, these risks can shift dramatically depending on where you are.
For those seeking precise insights, tools like AdensZip can be invaluable. By combining crime statistics with livability metrics, AdensZip simplifies the process of evaluating safety. Its Premium plan, priced at $9.99 per month, provides detailed ZIP code data to help you identify safer neighborhoods. Whether you’re planning a move, visiting, or just trying to better understand your surroundings, having access to reliable, data-driven information can help you navigate Houston with greater confidence.
FAQs
Which neighborhoods in Houston are considered the most dangerous in 2025?
In 2025, neighborhoods in Houston with the highest violent crime rates include parts of Council District A and central areas of the city. Specific locations, such as sections of the East End, Northside, and Southside, have been flagged as higher-risk zones based on recent crime data.
For anyone considering a visit or relocation to Houston, understanding the safety of different neighborhoods can help you make more informed choices about where to live, work, or explore.
How does Houston's violent crime rate compare to the national average?
Houston's violent crime rate in 2024 stood at 1,148 incidents per 100,000 residents, a stark contrast to the national average of 359.1 per 100,000 residents. This disparity underscores a noticeable gap in safety levels between Houston and the broader U.S. average.
Although certain neighborhoods in Houston are safer than others, staying informed about crime patterns and high-risk areas is essential if you're considering living, working, or visiting the city. Having a clear grasp of these statistics can empower you to make smarter, more informed choices.
What are the main reasons behind Houston's high crime rates?
Houston's crime rates are shaped by a mix of factors, including economic struggles, rapid population growth, and social disparities. Communities dealing with financial hardships or significant demographic shifts often see increased property crimes, such as vehicle theft and burglary.
High-traffic areas, like commercial hubs or tourist spots, can also become hotspots for criminal activity. On top of that, limited police staffing and resources can make it tougher to prevent and respond to these issues. Recognizing these challenges can empower both residents and visitors to make informed and safer decisions.